Li Chunli Thermo Fisher Scientific (China) Co., Ltd.
Summary
In this paper, an analytical method for the determination of polybrominated diphenyl ethers in aquatic products using a triple quadrupole GC/MS (GC-MS/MS) was developed. Soxhlet extraction was carried out after adding the internal standard BDE-77 to the sample. The extract was degreased by an automatic GPC system, purified by a multi-layer silica gel column, and separated on a 15 m long capillary gas chromatography column using GC-MS. /MS's Multiple Reaction Monitoring Mode (Timed-SRM), characterized by retention time and ion pair (parent and daughter ion) information, quantifies ion pairs with high response values. The results showed that the detection limit of the method was 0.1 pg/ul, and the relative standard deviation was 2.29-5.58%.
Foreword <br>polybrominated diphenyl ethers (PBDEs) are a kind of brominated flame retardants (BFRs), which are widely used in building materials and textiles due to their excellent flame retardant efficiency and thermal stability. , chemical, electronic and electrical industries. The demand for PBDEs has increased dramatically in the world in the past 10 years. Since the early 1980s, decabromodiphenyl ether has become the largest bromine-containing flame retardant in China.
As an added flame retardant, PBDEs are easily released into the environment from products, especially during electronic waste stacking and recycling. In 1981, the presence of PBDEs was found in barracudas, crickets and sea otters in Sweden [ 1], and then PBDEs were detected in marine fish, mussels, and sediments. [2] In 1987, Jansson et al. [3] first proposed to classify PBDEs as a class of global environmental pollutants. PBDEs are detected from air, water and human body, and their content has increased rapidly in the world in recent years [4~8]. A detailed survey of POPs in Swedish breast milk shows that other POPs in breast milk are more Chlorinated biphenyls showed a decreasing trend from the 1970s to the 1990s, but the PBDEs content has been increasing.
[9] Since then, Europe, North America, Japan, China and other regions have carried out research on PBDEs pollution in humans.
In this study, an automated GPC combined with multi-layer silica gel column purification technology for sample pretreatment-gas chromatography triple quadrupole mass spectrometry was established to determine the polybrominated diphenyl ethers in aquatic products. This article describes the use of Thermo Fisher Scientific's new generation of triple quadrupole gas chromatography mass spectrometer (TSQ 8000) for the analysis of seven PBDEs in aquatic products. The secondary mass spectrometry scan greatly reduces the influence of background interference in complex matrix samples and improves the detection sensitivity of the target compound. The method has the advantages of low sensitivity, good stability and wide linear range.
Experimental part
Instrument and reagent mass spectrometer: TSQ 8000 mass spectrometer (Thermo Fisher Scientific, USA);
Gas Chromatograph: Trace 1310 GC with AI 1310 Autosampler (Thermo Fisher Scientific, USA);
Column: TG-5MS 15 m*0.25 mm*0.1 μm capillary column;
Reagents: dichloromethane, ethyl acetate, cyclohexane, n-hexane: pesticide residue level;
Instrument Method <br> Gas Phase Method:
Column oven: 100 ° C (maintained for 1.5 min), 35 ° C / min to 200 ° C, 25 ° C / min to 280 ° C (maintained for 5 min); inlet: splitless injection, no split time: 1 min, liner : inert without split (item No.: 453A1925), inlet temperature is 280oC; carrier gas: constant current, 1.5 ml/min; transmission line: 280oC
Mass spectrometry method:
The ion source temperature is 300 oC, using the Acquisition-Timed method, SRM scanning,
Specific detection ion pairs are shown in Table 1. 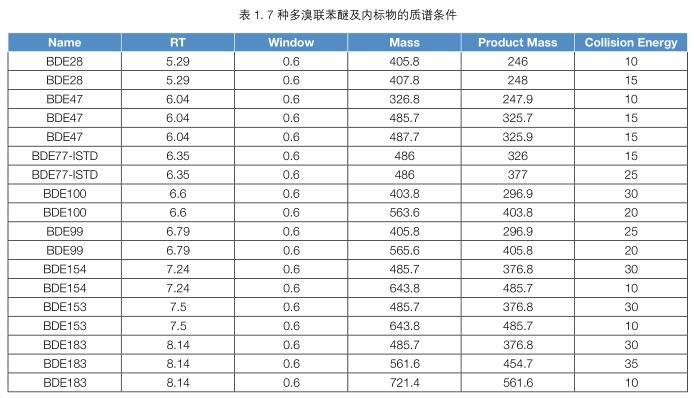
Pretreatment method <br>Extraction: Accurately weigh 5.0g (accurate to 0.01g) of the homogenized fish sample in the cellulose extraction sleeve, add 1 ng internal standard BDE-77 standard solution, and then add appropriate amount Anhydrous sodium sulfate was covered with glass wool, and Soxhlet extraction was carried out for more than 12 hours (about 4 times/h) with 200 mL of n-hexane/acetone (1:1, v / v) solution. After Soxhlet extraction, the extract was steamed to dryness and the fat content was calculated gravimetrically. The residue was dissolved in ethyl acetate/cyclohexane (1:1, v/v) solution to a volume of 6 mL and purified by GPC.
GPC Purification: Transfer the above extract to an automated gel purification system using a low pressure packed column with a column size of 2 cm × 50 cm, a packing of 50 g Bio-Beads S-X3, a sample tube to a volume of 6 mL, and a sample injection 5mL. The mobile phase was an ethyl acetate / cyclohexane (1:1, v / v) solution, flow rate 5 mL / min, isocratic elution. The UV detection wavelength was 240 nm. The effluent component of 20-40 min was collected by an automatic solvent evaporation system and evaporated to near dryness under reduced pressure. Reconstituted by adding 2 mL of n-hexane, the next step was to be purified.
Multi-layer silica gel column purification: fill a 1.5cm × 10cm glass column with appropriate amount of glass wool, and then fill 1 cm high anhydrous sodium sulfate, 1g neutral silica gel, 3g acidified silica gel, 1g neutral silica gel from bottom to top. And 1 cm high anhydrous sodium sulfate. Pre-rinse with 10 mL of n-hexane, transfer the GPC purification solution to the column, elute with 20 mL of n-hexane, and elute with 20 mL of n-hexane/dichloromethane (1:1, v / v) solution. All eluates were collected and rotatively evaporated to at least volume, transferred to a vial, blown dry with nitrogen, reconstituted with 100 μL of n-hexane and transferred to an endotube for injection.
Experimental Results Analysis <br>Target Secondary Mass Spectrometry Optimization-AUTO SRM Effect Display: AUTO SRM only needs to mix target objects, and the whole process is automated. No complicated instrument method editing and data browsing are required, and the optimization results are visually reflected. Specific compounds The specific ion pair is optimized according to the collision energy, and the system automatically sorts the response of the ion pair. We only need to select the channel with the highest response. As shown in the figure below, taking BDE28 as an example, a 5-50 gradient experiment was performed on the CE collision energy by a single injection, and the response intensity of the ion is automatically aligned, and the system has selected the highest response collision energy. That is the optimal secondary mass spectrometry information.
At the same time, more than 40 kinds of targets can be optimized in one experiment, and the obtained ion pair information can be directly imported into the instrument method editing interface for data acquisition, which greatly improves the work efficiency.
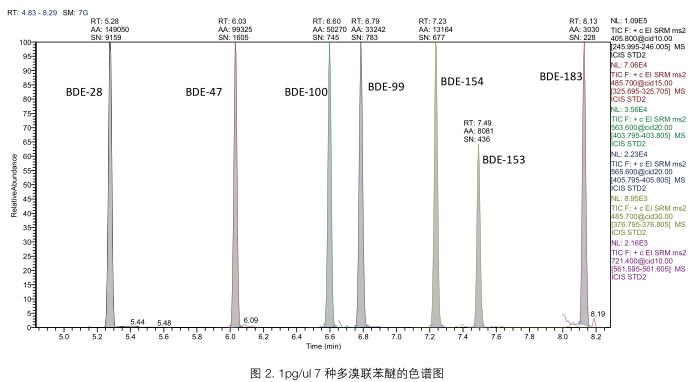
Chromatographic Separation Results <br>The SRM mass spectrometry conditions (parent ion-subion-collision energy) of each compound can be determined by optimizing the collision energy by Auto-SRM mode. See Table 1 under these conditions, and the SRM of 7 polybrominated diphenyl ethers can be obtained by running the sample under this condition. The chromatogram is shown in Figure 2. 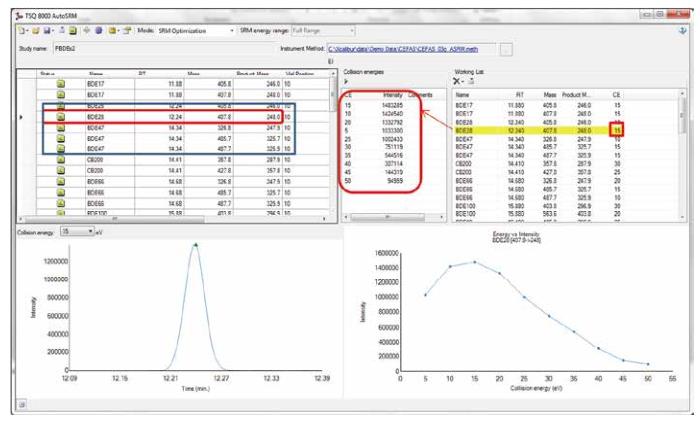
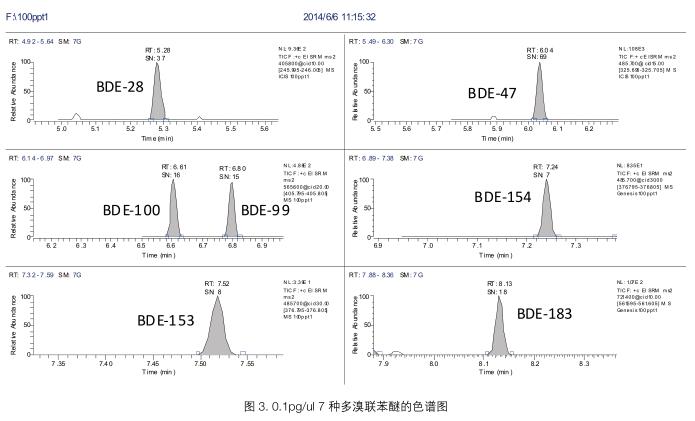
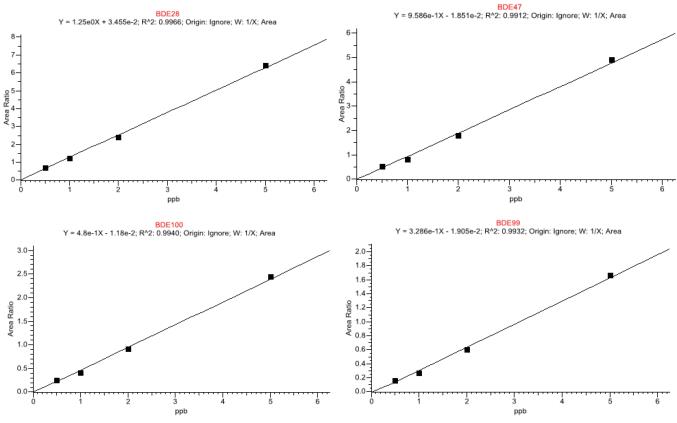
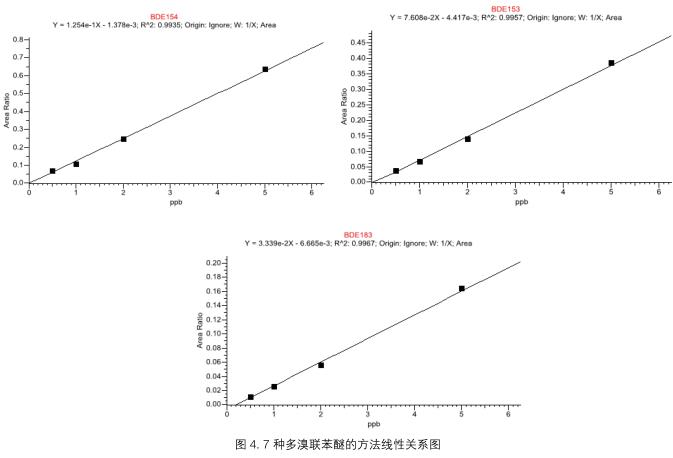
Standard curve and minimum limit of quantitation <br>Standard and internal standard (PBDE-77, 10 pg/ul) were added to the negative sample according to EU standards. The concentration of PBDEs was 0.5pg/ul, 1pg/ul, 2pg. /ul, 5 pg/ul, chromatographic-mass spectrometry according to 2.2. With S/N=3 as the detection limit, the detection limit spectrum is shown in Figure 3. It can be seen from Figure 3 that the S/N= of the seven PBDEs is greater than 3. Taking the standard solution concentration as the abscissa (X), the chromatographic peak area of ​​the quantitative ion pair is plotted on the ordinate (Y), and the regression equation is obtained. The linearity of the 7 PCBs in the range of 0.5pg/ul to 5pg/ul is good, the correlation coefficient is greater than 0.991, and the linear equation is shown in Fig. 4. The detection limit of this method is better than the reported value in the literature, which can ensure the qualitative and quantitative detection of 7 PBDEs residues in the sample.
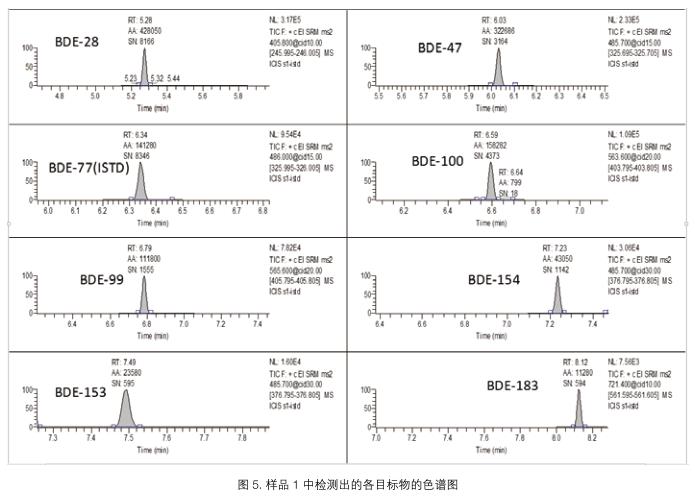
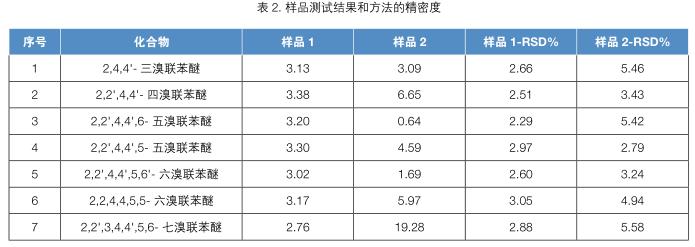
Actual sample detection and determination of method precision <br> According to the experimental method, two actual samples were analyzed and tested, and 7 samples were continuously injected for each sample, and the relative standard deviation RSD% of each compound was calculated. Experimental Results Table 2 shows that the target organic pollutants are contained to varying degrees in both samples. The relative standard deviation (RSD, n=7) of the test method is 2.29-5.58%. 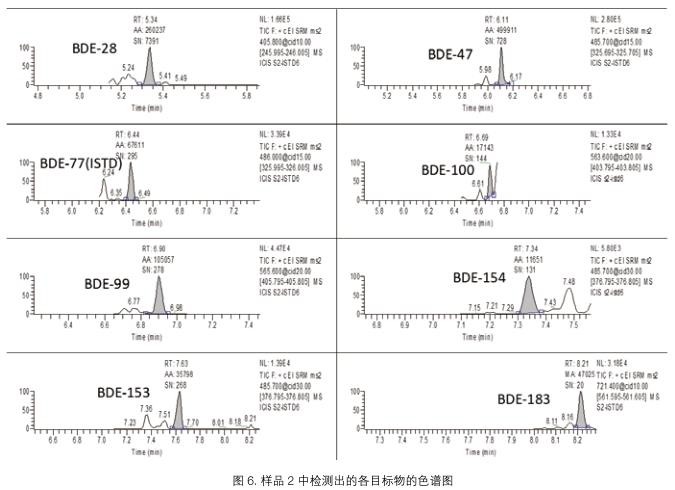
3. Conclusion
The method uses ThermoFisher's new generation triple quadrupole mass spectrometer TSQ8000 to determine the residues of seven polybrominated diphenyl ethers in aquatic products, with high sample extraction rate and convenient operation. The instrument has the advantages of good selectivity, wide linear range and high sensitivity. At the same time, the ion pair scanning provided by the TSQ8000 can greatly eliminate the interference of false positives, thus making the detection result more accurate. In a complex matrix, the relative standard deviation (RSD, n=7) of the instrument is 2.29-5.58%. The minimum detection limit for the seven PBDEs involved in this analytical test method was 0.1 pg/ul. It can fully meet the testing requirements of PBDEs in the EU and countries.
references
1. Andersson Ö, Blomkvist G. Polybrominated aromatic pollutants found in fish in Sweden. Chemosphere, 1981, 10:1051-1060.
2. Watanabe I, Kashimoto T, Tatsukawa R. Polybrominated biphenyl ethers in marine fish, shellfish and river and marine sediments in Japan. Chemosphere, 1987, 16: 2389-2396.
3. Jansson B, Asplund L, Olsson M. Brominated flame rerardantsubiquitous environmental pollutants? Chemosphere, 1987, 16:2343-2349.
4. Li A, Rockne KJ, Sturchio N, et al. Polybrominated diphenyl ethers in the sediments of the Great Lakes. 4. Influencing factors, trends, andimplications. Environ Sci Thehnol, 2006, 40:7528-7534.
5. Rayne S, Ikonomou MG, Antcliffe B. Rapidly increasing polybrominated diphenyl ether concentrations in the Columbia River System from 1992 to 2000. Environ Sci Technol, 2003, 37:2847-2854.
6. Song W, Ford JC, Li A, et al. Polybrominated diphenyl ethers in the sediments of the Great Lakes 3 Lakes Ontario and Erie. Environ Sci Technol, 2005, 39: 5600-5605.
7. Kim BH, Ikonomou MG, Lee SJ, et al. Concentrations of polybrominated diphenyl ethers, polychlorinated dibenzo-pdioxins and dibenzofurans, and polychlorinated biphenyls in human blood samples from Korea. Sci Total Environ, 2005, 336:45-56.
8. Thomsen C, Lundanes E, Becher G. Brominated flameretardants in archived serum samples from Norway: A study on temporaltrends and the role of age. EnvironSci Technol, 2002, 36: 1414-1418.
9. Sudaryanto A, Kajiwara N, Takahashi S, et al. Geographical distribution and accumulation features of PBDEs in human breast milk from Indonesia. Environ Pollut, 2007, 151: 130-138.
Interventional Accessories,Introducer Sheath,Introducer Sheath Kit,arterial sheath introducer
Anesthesia Medical Co., Ltd. , https://www.jssinoanesthesia.com